Chapter 10 Mapping in R
## To enable caching of data, set `options(tigris_use_cache = TRUE)`
## in your R script or .Rprofile.## Warning: package 'sf' was built under R version 4.3.3## Linking to GEOS 3.11.2, GDAL 3.8.2, PROJ 9.3.1; sf_use_s2() is TRUELoad counties of Vermont using Tigris package
Query all states
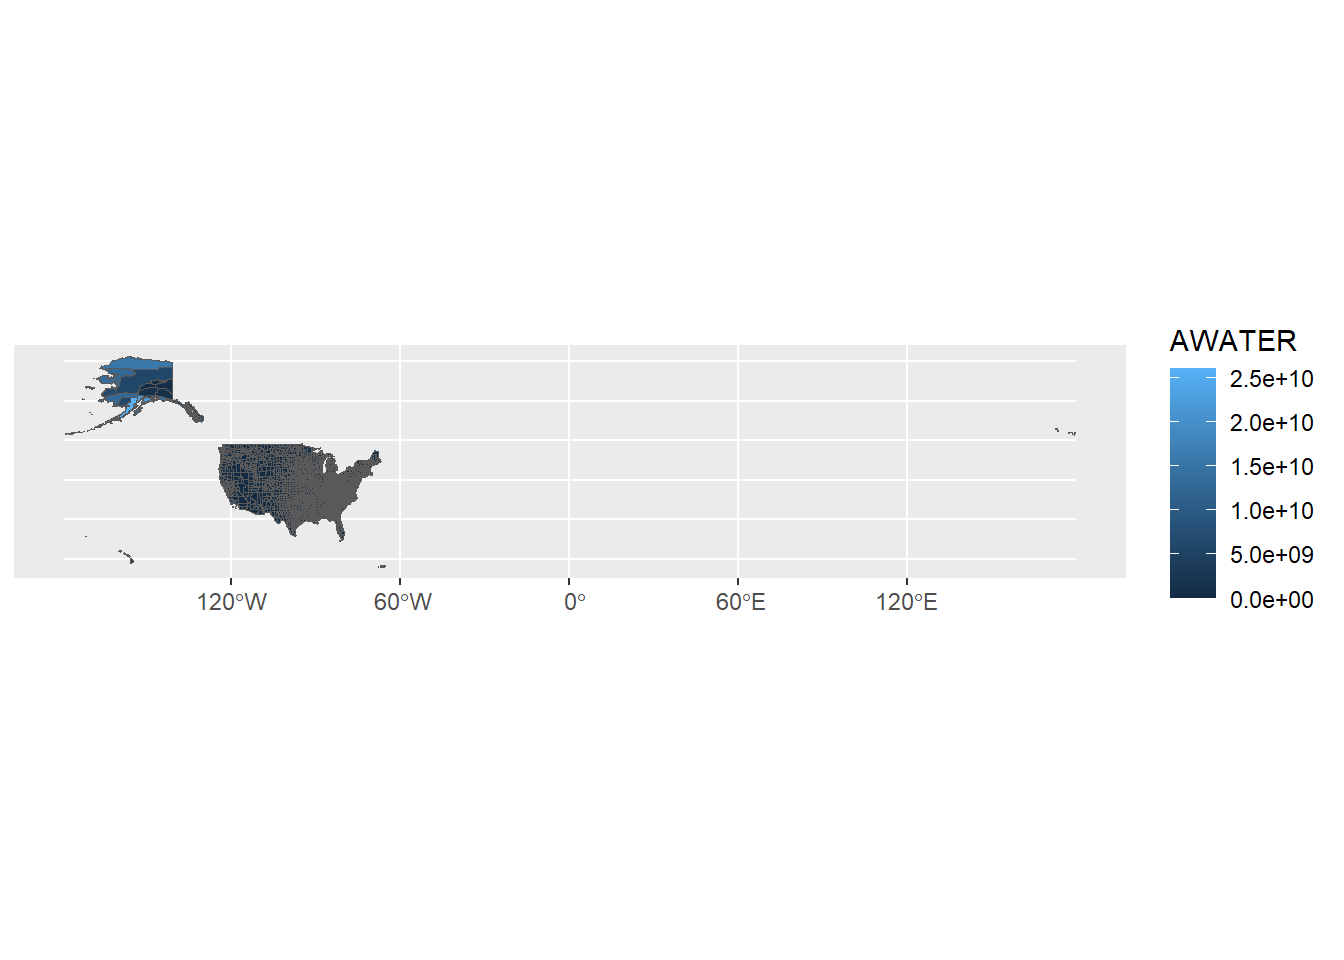
Map all states
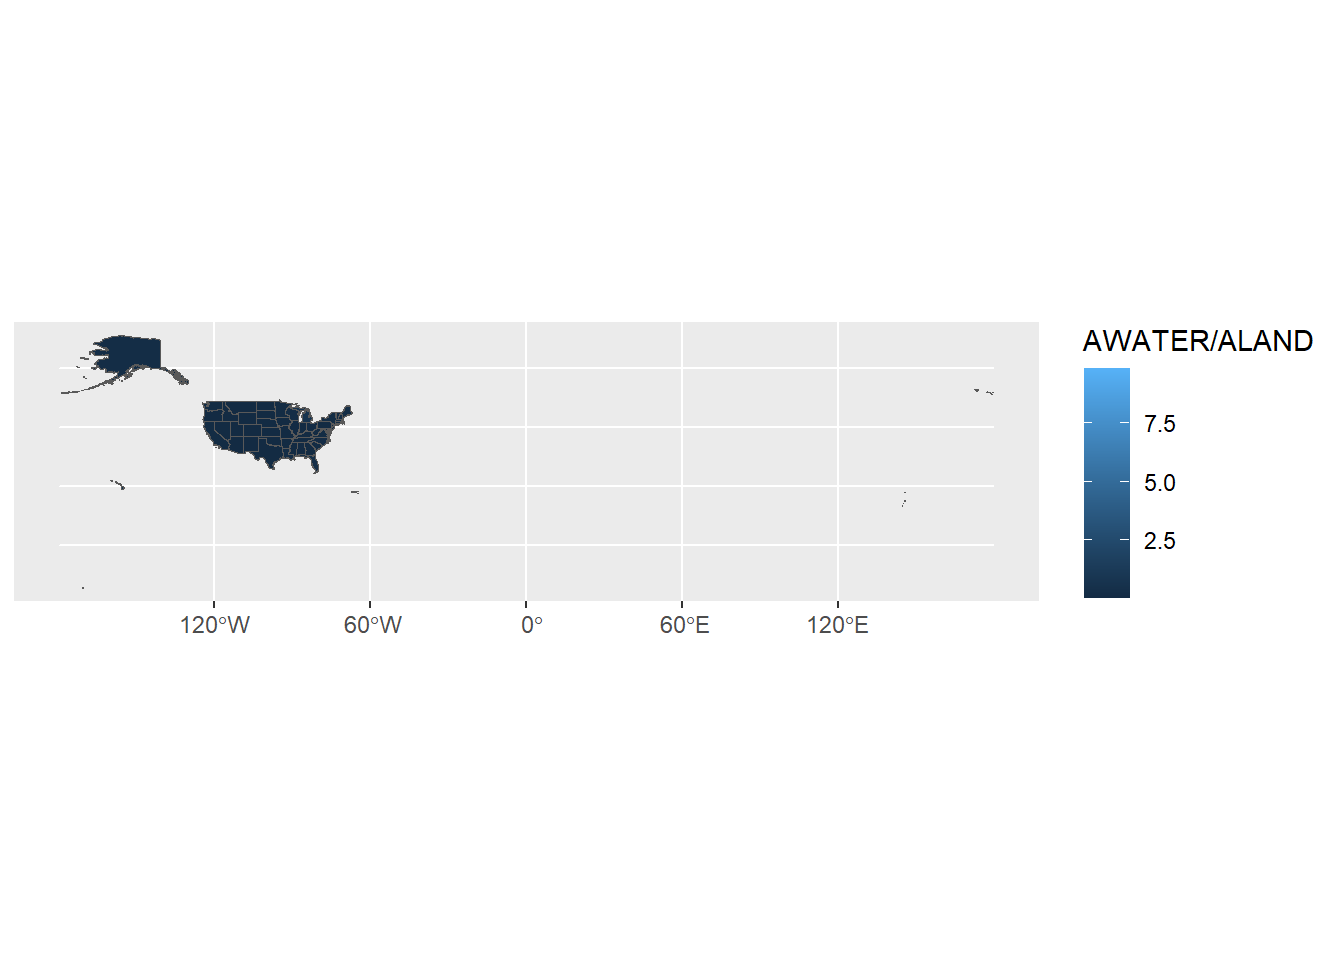
Shift the geometry of the coordinates and filter out territories
all_states |>
shift_geometry() |>
filter(as.numeric(GEOID) < 60) |>
ggplot() +
geom_sf(aes(geometry = geometry, fill = AWATER/ALAND))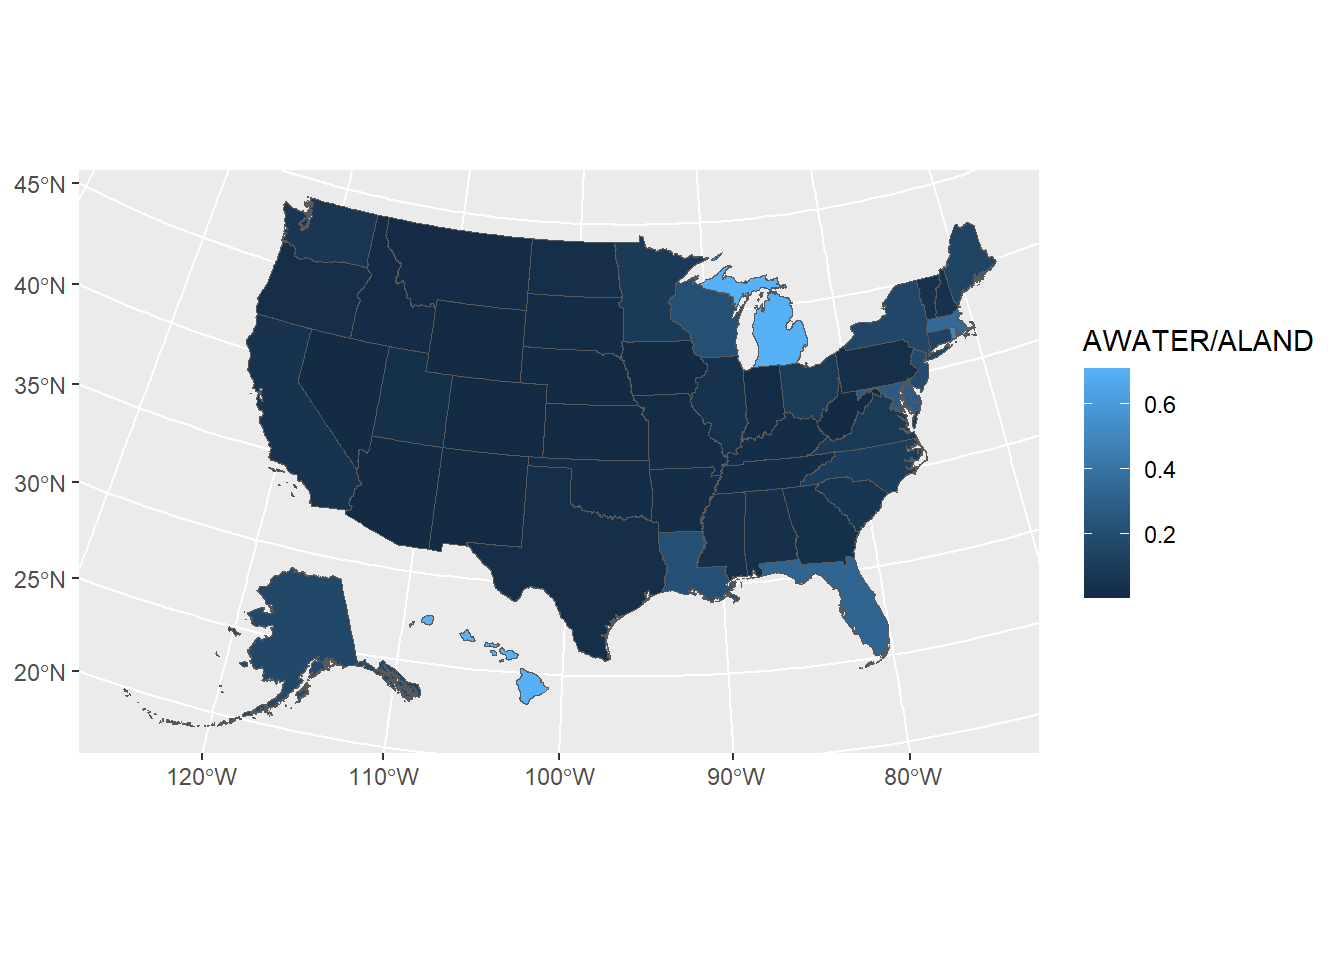
10.1 Map alcohol consumption per capita
Scrape alcohol data
url <- "https://wisevoter.com/state-rankings/alcohol-consumption-by-state/"
alcohol <- url |>
read_html() |>
html_element("table") |>
html_table()Join alcohol to states
all_states_booze <- all_states |>
filter(GEOID < 60) |>
left_join(alcohol, by = join_by("NAME" == "State"))all_states_booze <- all_states_booze |>
mutate(alcohol_per_cap = as.numeric(str_remove(`Alcohol Consumption Per Capita`, " gal")))Make a map!
all_states_booze |>
shift_geometry() |>
filter(as.numeric(GEOID) < 60) |>
ggplot() +
geom_sf(aes(geometry = geometry, fill = alcohol_per_cap)) +
scale_fill_binned()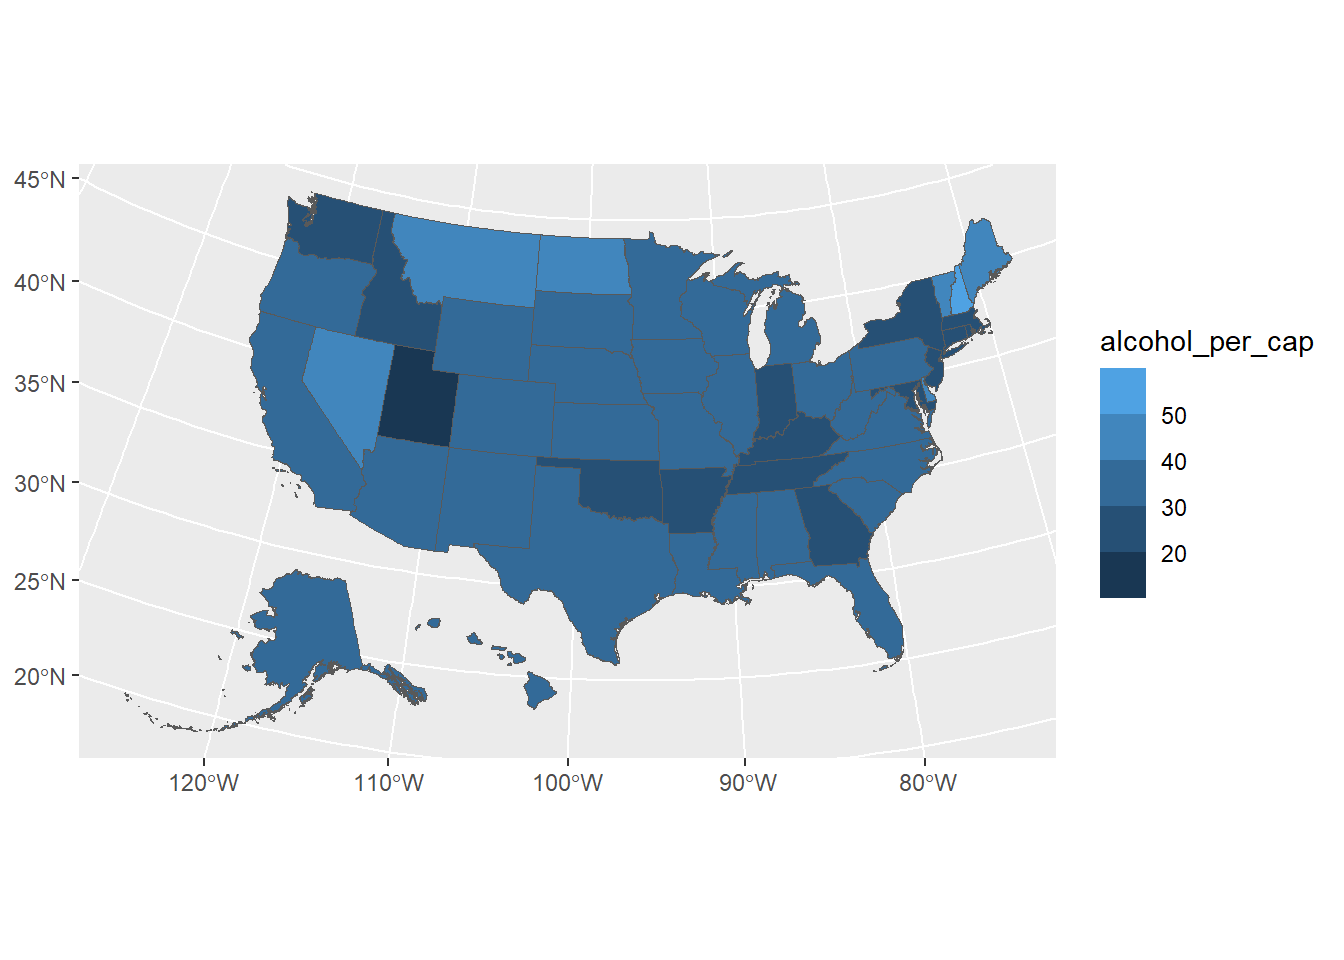
Make an interactive map with Leaflet
10.2 Map volcanoes
Load the dataset
## Rows: 1608 Columns: 11
## ── Column specification ─────────────────────────────────────────────
## Delimiter: "\t"
## chr (7): Search Parameters, Volcano Name, Country, Location, Type, Status, L...
## dbl (4): Volcano Number, Latitude, Longitude, Elevation (m)
##
## ℹ Use `spec()` to retrieve the full column specification for this data.
## ℹ Specify the column types or set `show_col_types = FALSE` to quiet this message.## # A tibble: 5 × 11
## `Search Parameters` `Volcano Number` `Volcano Name` Country Location Latitude
## <chr> <dbl> <chr> <chr> <chr> <dbl>
## 1 [] NA <NA> <NA> <NA> NA
## 2 <NA> 250010 St. Andrew Str… Papua … Admiral… -2.38
## 3 <NA> 250020 Baluan United… Admiral… -2.57
## 4 <NA> 250030 Central Bismar… United… Admiral… -3.03
## 5 <NA> NA Dacht-I-Navar … Afghan… Afghani… 34.0
## # ℹ 5 more variables: Longitude <dbl>, `Elevation (m)` <dbl>, Type <chr>,
## # Status <chr>, `Last Known Eruption` <chr>Map the volcanoes
volcanoes |>
leaflet() |>
addTiles() |>
addMarkers(lat = ~Latitude,
lng = ~Longitude,
label = ~`Volcano Name`)Cluster markers
volcanoes |>
leaflet() |>
addTiles() |>
addMarkers(lat = ~Latitude,
lng = ~Longitude,
label = ~`Volcano Name`,
clusterOptions = markerClusterOptions())Circles
volcanoes |>
leaflet() |>
addTiles() |>
addCircles(lat = ~Latitude,
lng = ~Longitude,
label = ~`Volcano Name`,
radius = 15000,
color = "red",
weight = 1,
fillOpacity = 0.8)Map alcohol consumption with leaflet
Load India data from a shapefile
## Reading layer `Indian_States' from data source
## `C:\GitHub\opengisci\wt25_josephholler\data_public\indiashp\Indian_States.shp'
## using driver `ESRI Shapefile'
## Simple feature collection with 36 features and 1 field
## Geometry type: MULTIPOLYGON
## Dimension: XY
## Bounding box: xmin: 68.18625 ymin: 6.755953 xmax: 97.41529 ymax: 37.07827
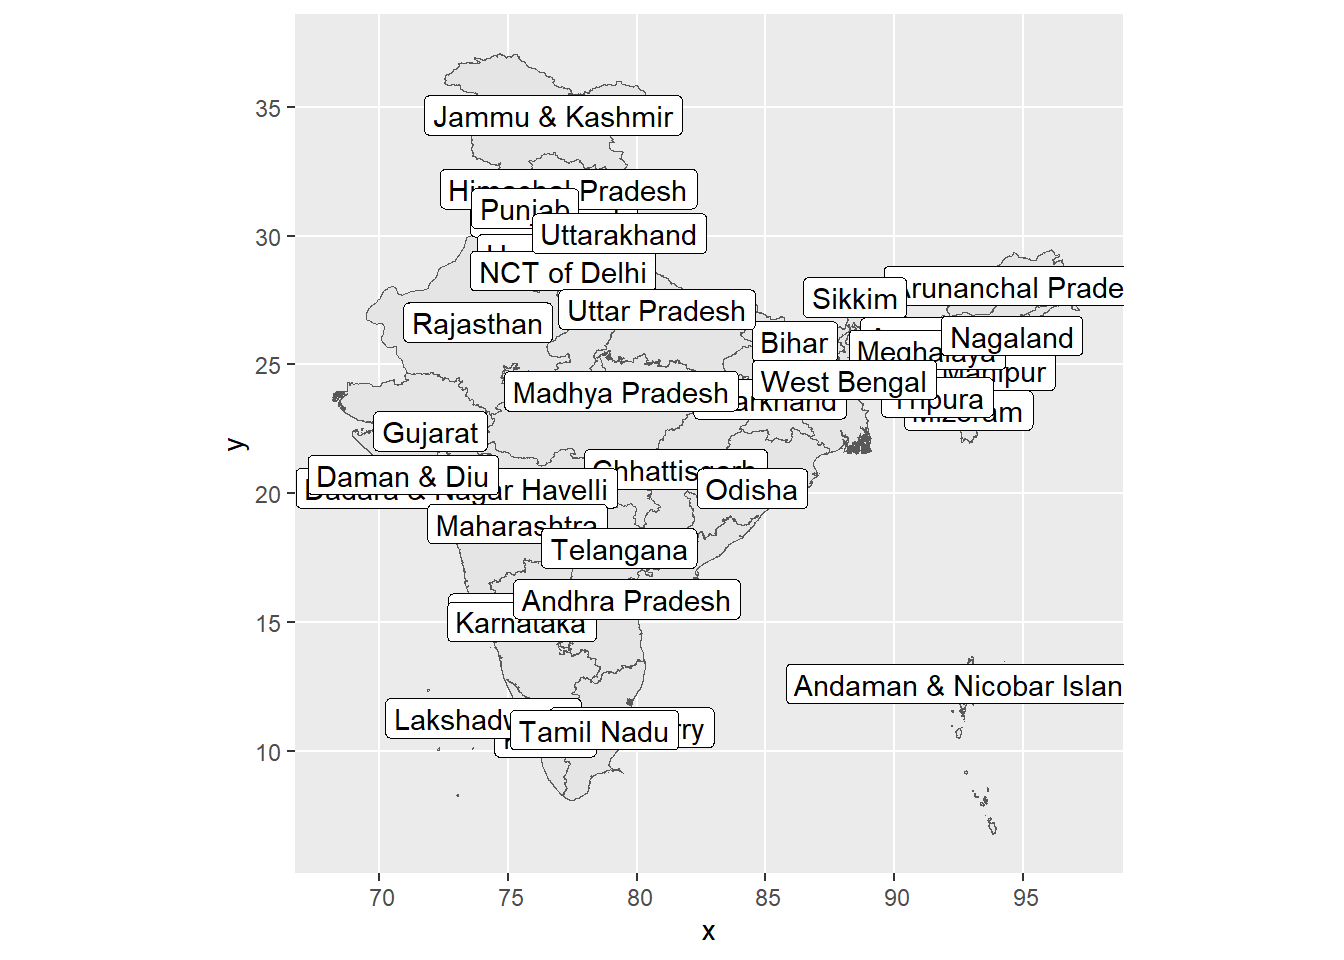
## CRS: NAMap Indian states with ggplot
Map Indian states with leaflet